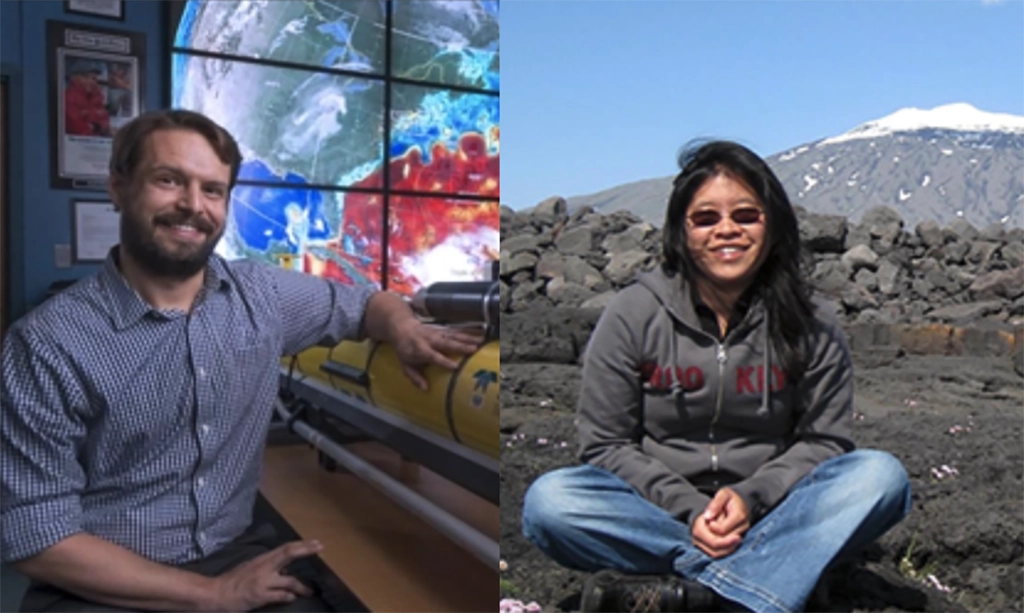
Congratulations to Travis Miles and Kim Thamatrakoln who are being promoted to Associate Professors and granted tenure. They have worked so hard and are important to our marine nerd family, so we celebrate their well deserved success! Travis’s research is focused on processes that are associated with physical ocean boundaries, including ocean interactions with the […]
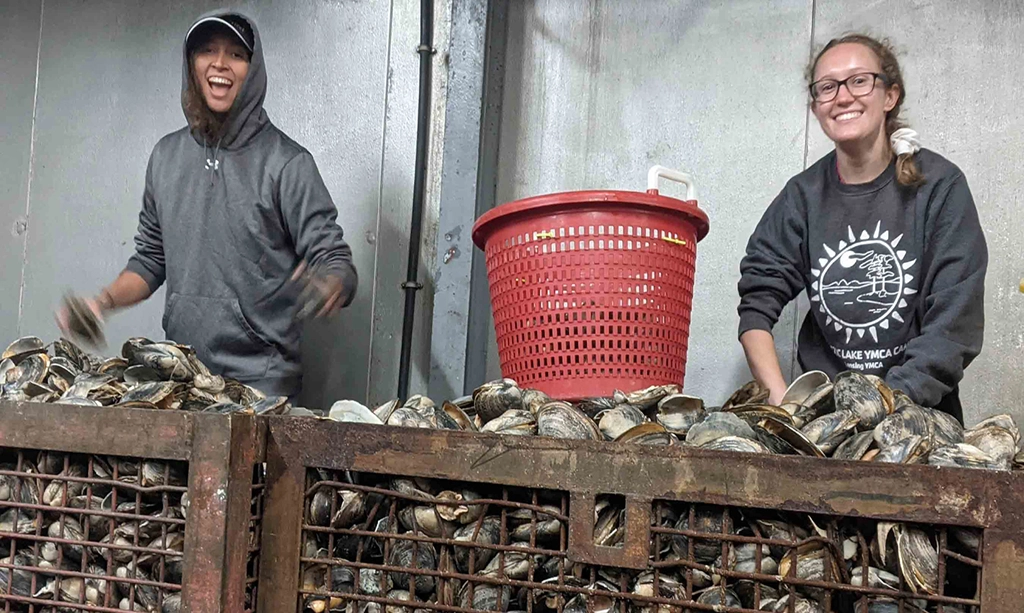
Rutgers scientists point to improved environmental conditions as possible reason The Atlantic surf clam, an economically valuable species that is the main ingredient in clam chowder and fried clam strips, has returned to Virginia waters in a big way, reversing a die-off that started more than two decades ago. In a comprehensive study of surf […]
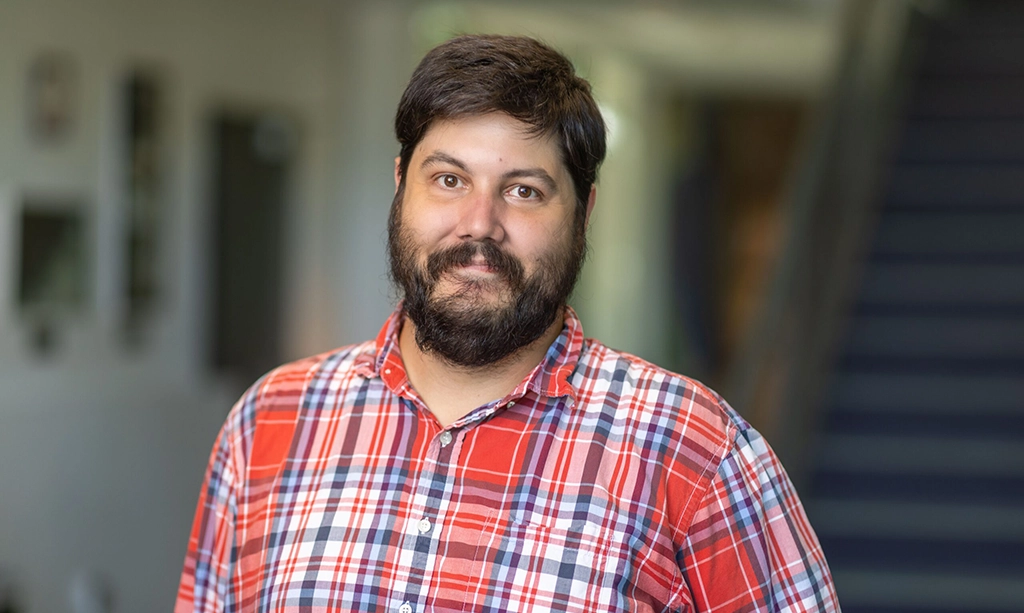
Alex López was one of three faculty speakers for OTEAR’s “Inclusive Practices Spotlight: Strategies from Rutgers’ Instructors” workshop this Friday, highlighting the value of student-led learning and sharing implementation strategies used in the MS of Operational Oceanography degree program. Faculty across Rutgers are incorporating various strategies to create inclusive learning environments for their students. This […]
The Rutgers University Center for Ocean Observing Leadership (RUCOOL) is creating knowledge of our ocean planet by pushing the limits of science and new technologies while inspiring future generations of ocean explorers.
Hurricane Science

The RUCOOL Hurricane Science Team develops and uses advanced observing technologies and models to better understand coupled ocean-atmospheric processes in tropical cyclones.
Offshore Wind

The RUCOOL Offshore Wind team develops and advances the science that informs decision-making around offshore wind, both at a state and national level.
Polar Science / LTER

RUCOOL scientists are engaged in polar research using both regional & global climate models, via large collaborative efforts that utilize undergraduate and graduate framework.
Ocean Acidification

The RUCOOL Ocean Acidification Team develops and uses advanced observing technologies to address hypotheses related to identifying and evaluating the drivers of acidification.
Integrated Ocean Technology

RUCOOL develops and operates state-of-the-art ocean sensor technologies, integrating their data products together to get the most comprehensive 3d view of the ocean possible.
Empowering the next generation

RUCOOL is innovating education practices to enable all humanity be active explorers of their ocean planet. These tools are being used to develop the next generation of ocean scientists and engineers.
Copyright© 2024 Rutgers, The State University of New Jersey and Rutgers Center for Ocean Observing Leadership: RUCOOL. All rights reserved. Rutgers University is an equal access/equal opportunity institution. Individuals with disabilities are encouraged to direct suggestions, comments, or complaints concerning any accessibility issues with Rutgers web sites to: accessibility@rutgers.edu or complete the Report Accessibility Barrier or Provide Feedback